Most CMOs we talk to describe the same symptom: “My team can’t explain why the last campaign worked or didn’t. The A/B tests don’t give us a clean signal. We’re making decisions on gut, and it’s starting to cost us.”
They’re not wrong. The leading indicators email marketers have relied on for two decades — opens and clicks — have been progressively corrupted by three trends, none of which are reversing. Most marketing organizations are still running their programs as if those numbers mean what they meant in 2019. They don’t.
This is a practical problem, not an abstract one. Without trustworthy leading indicators, an email program can’t tell what’s working. It can’t A/B test into subject-line improvements, segmentation improvements, timing improvements, or creative improvements. It falls back to measuring form submits, which fire too late in the funnel to steer anything upstream. The result is expensive programs shipping in a straight line, with no information to correct course.
Here’s what the public record says about the scale of the distortion.
Three things that broke the signal
1. Privacy proxies — Apple Mail Privacy Protection
Apple Mail Privacy Protection launched in 2021. It pre-fetches every email’s images through Apple’s servers as soon as the message is delivered — whether or not the recipient ever sees the email. Apple Mail now accounts for 50–60% of recorded email opens globally, per Litmus’s 2026 report.1 In the six months after MPP launched, one publisher’s before/after analysis across roughly 2 billion emails showed unique open rates nearly double — from 15.2% to 29.0% — with no change in underlying human behavior.2
Put plainly: at least half of your “opens” are a proxy server. Not a person.
2. Secure Email Gateways — link scanning at corporate scale
If you send to corporate inboxes, your messages are routed through enterprise security scanners — Microsoft Defender SafeLinks, Proofpoint URL Defense, Mimecast URL Protect, Barracuda. These scanners click every link in your email to check for malware, generating click events that are indistinguishable from human clicks as far as your ESP is concerned.
M3AAWG’s 2020 working paper — still the most-cited industry reference today — puts non-human interaction at 20–80% of B2B clicks.3 Omeda, a major newsletter platform sending roughly 8 billion emails per year, reported in 2023 that bot clicks averaged 63% on their platform, peaking at 77% in individual months.4 Consumer-heavy senders like AWeber reported 5% over the same period.4 Your exposure depends entirely on your list composition — and most marketing teams have never measured theirs.
3. AI user agents — new, growing fast, and harder to detect
This category didn’t exist when M3AAWG’s 2020 paper was written. ChatGPT, Claude, and Perplexity now make web requests on behalf of users. As early as March 2025 — and before the second wave started — Iterable was already counting more than 3 million clicks per day from ChatGPT and ClaudeBot user agents alone.5
The second wave is “agentic browsers”: full Chromium instances driven by an AI assistant on a user’s behalf. Perplexity Comet launched in July 2025, ChatGPT Atlas in October 2025. In the nine months since, HUMAN Security’s infrastructure-wide data shows agentic-browser traffic has grown 6,900%.6 No one has published an updated email-specific figure for either sub-category, but the trajectory across multiple independent measurements is unambiguous: up and to the right.
The three streams combine differently for every sender, and the composition is dominated by factors outside your control: recipient domain mix, Secure Email Gateway deployment among recipient companies, device distribution, geographic footprint.
The industry’s fallback is already failing
For the last five years, the prescribed response to “opens are broken” has been: stop optimizing on opens, optimize on clicks. Only 15% of email marketers still treat open rates as their primary success metric, per Litmus’s 2025 survey.7 The industry has already moved.
The problem: in many programs, clicks are dirtier than opens, not cleaner. Opens are polluted mostly by privacy proxies, which are identifiable and filterable. Clicks are polluted by Secure Email Gateways, AI user agents, and link-preview bots (Slack, Teams, LinkedIn when an email gets shared) — three independent streams, very few of which your ESP discloses to you.
The next fallback — “skip clicks, optimize on form submits” — isn’t a fallback. It’s a cliff. Form submits fire too late in the funnel to drive A/B testing on subject lines, preview text, layouts, send times, or list segmentation. Measuring only form submits means your experiments need 10–100× more volume to reach statistical significance, which means you run fewer of them, which means the program improves more slowly. And form submits themselves are starting to show bot pollution as AI agents auto-complete forms on users’ behalf.
The effect at the CMO level is a loss of leading indicators. Pipeline contribution from email becomes a trailing metric with no upstream signal to tune against. That’s not a better program; that’s an unsteerable one.
A deliverability risk most CMOs aren’t being briefed on
Gmail tightened its authentication enforcement in November 2025. Senders with high spam-complaint rates or authentication failures now face permanent rejection, not just inbox-folder demotion.8 That enforcement doesn’t explicitly target bot-inflated engagement — but if your program’s reported engagement looks strong on a dashboard while Gmail’s behavioral models flag your actual inbox placement as low-quality, those two signals are going to diverge in ways that matter to your deliverability team.
This is worth asking about. Not because bot clicks cause Gmail to penalize you directly — no email provider has published that mechanism — but because the metric you use to trust a program’s health (“engagement is high”) may be unrelated to the signal Gmail uses to place your mail.
The signal most marketing teams aren’t looking at
Every email click has a second independent observation: the website session that should result from it. Your ESP logs one count. Your web analytics (GA4, Adobe, Snowplow) logs another. The two counts diverge — always, everywhere. The industry rule of thumb is that 10–20% is “normal” technical friction.9
The composition of that gap is not normal. Some of it is ad blockers — roughly 29.5% of global internet users ran one at least sometimes as of 2025.10 Some of it is in-app browsers. Some of it is tab-close-before-the-tag-fires. And some of it is bots — specifically the Secure Email Gateway scans and declared AI crawlers that click your links but don’t execute JavaScript on the landing page, and therefore never become web analytics sessions.
Most teams don’t look at this gap. Most ESPs can’t surface it. Most web analytics tools don’t expose the breakdown either — GA4 specifically is estimated to catch fewer than 50% of non-human sessions,11 and Plausible’s controlled 2025 test showed GA4 recording every simulated bot pageview they threw at it while Plausible rejected all three scenarios.12
Tracking the per-campaign trend in this gap is one of the least-used leading indicators available. Not the absolute level — the trend. A campaign whose click-to-session ratio suddenly spikes is very likely experiencing a surge in non-human traffic, and will correspondingly mislead your A/B test.
What “Reported vs Truth” actually looks like
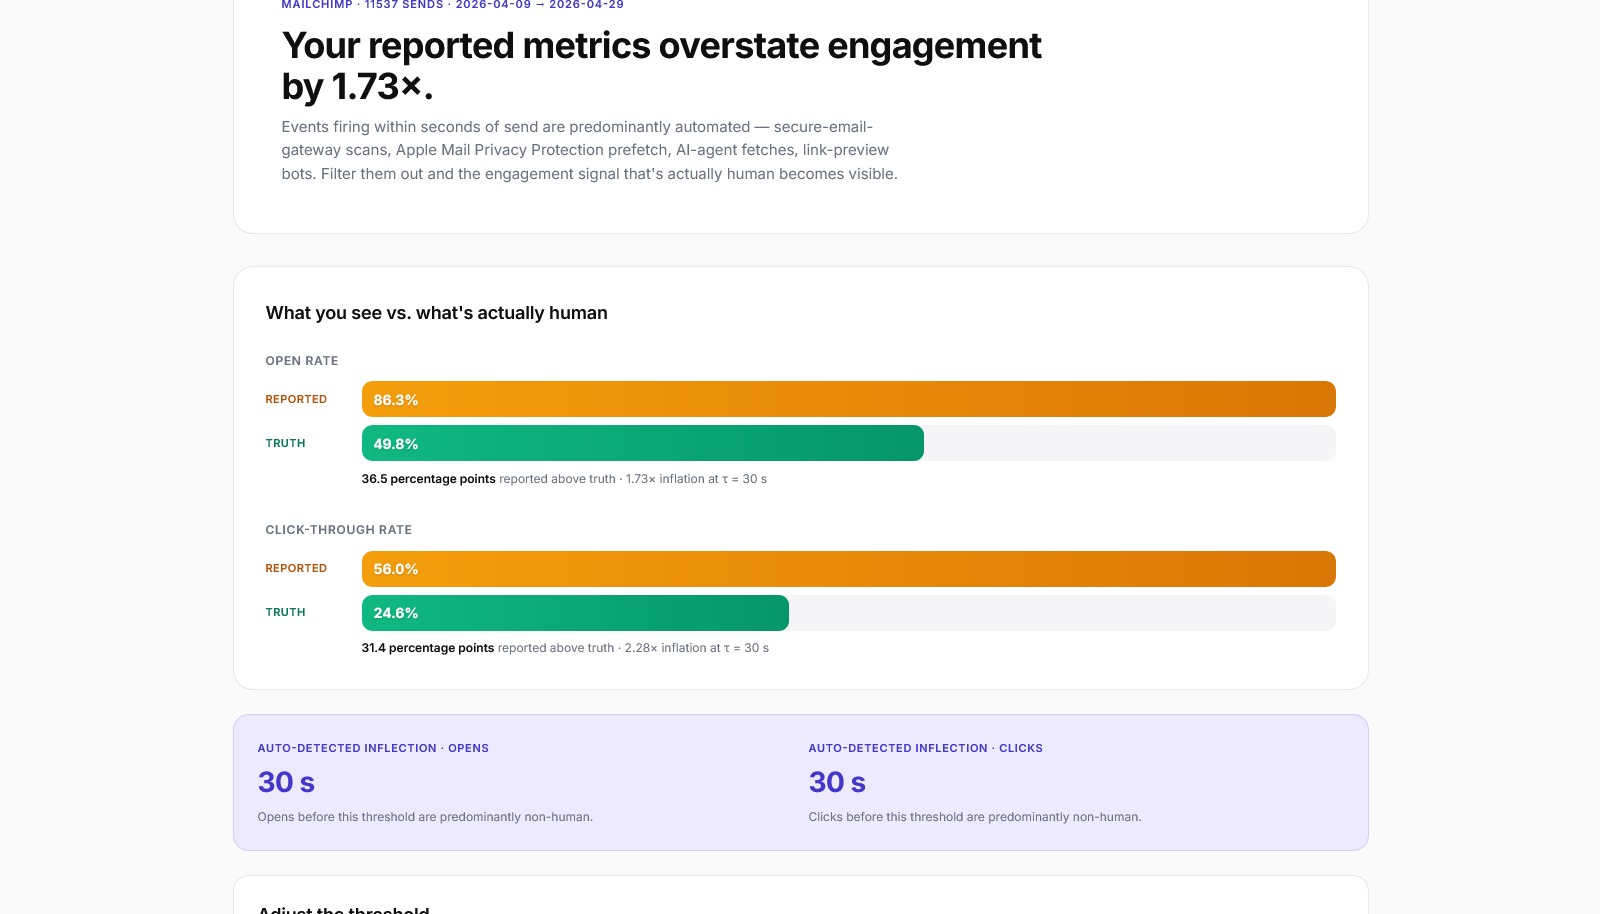
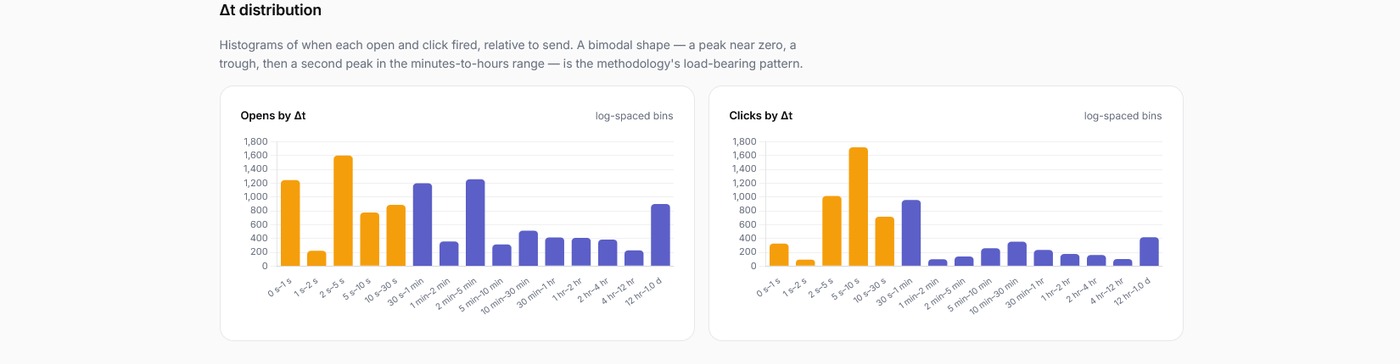
We’ve been building an open-source analyzer that ingests an ESP’s event-level data and computes a per-campaign inflection point — the time-from-send threshold below which engagement is predominantly non-human. Filter out events firing before the inflection, and the engagement signal that’s actually human becomes visible.
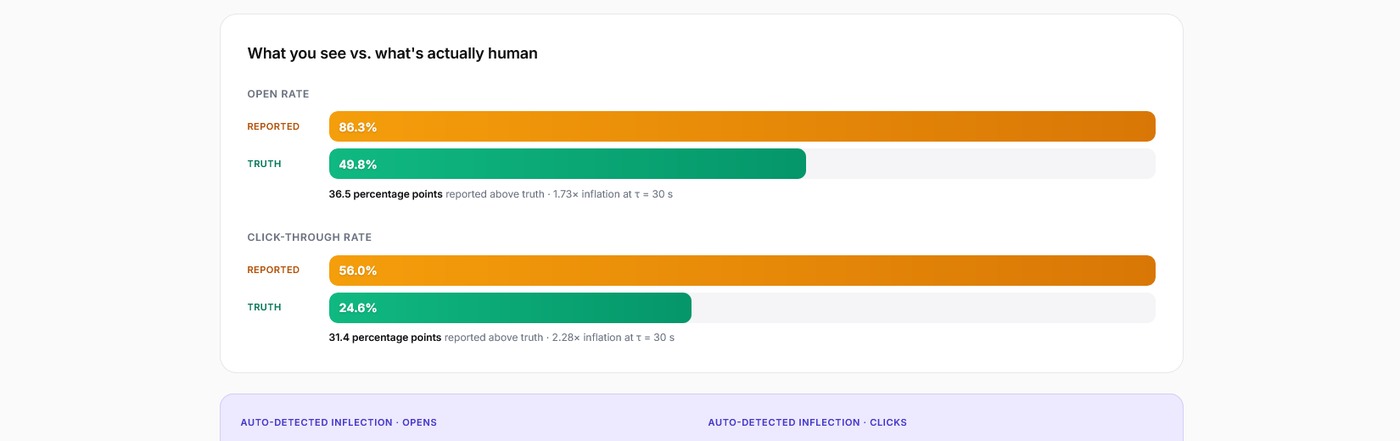
The screenshot above is from a sample B2B-leaning email send. Reported open rate: 86.3%. Truth open rate: 49.8%. The 36.5-percentage-point gap is the bot floor — security scanners, privacy proxies, and AI agents firing the open pixel within seconds of delivery, before any human has so much as glanced at the inbox. The methodology calculates a 30-second inflection point automatically; a slider lets the user move the threshold to see the impact at different cutoffs.
This is not a hypothetical exercise. Every public number we cite in the sections above corresponds to events that already exist in your ESP’s database, and the methodology to separate them is statistical, well-grounded, and reproducible.
State of non-human email engagement, 2026
| Metric | Figure | Source |
|---|---|---|
| Apple Mail share of recorded email opens globally | 50–60% | Litmus 20261 |
| B2B non-human click range (2020 benchmark, still widely cited) | 20–80% | M3AAWG3 |
| Bot-click share on a major newsletter platform, 2023 (8B emails/year) | 63% avg, 77% peak | Omeda via Inbox Collective4 |
| Daily ChatGPT + ClaudeBot clicks at one ESP, March 2025 (pre-agentic-browsers) | 3+ million | Iterable5 |
| Agentic-browser traffic growth (July 2025 → present, industry-wide) | 6,900% | HUMAN Security6 |
| Estimated GA4 catch rate for non-human sessions | <50% | Kissmetrics / Plausible1112 |
Three questions to ask your email team this week
1. “What’s our ESP’s bot filter catching, and can you show me Reported-versus-Filtered click rates per campaign side by side?”
Every major ESP now filters — Mailchimp, HubSpot, Klaviyo, Braze, Iterable, Mailgun, Constant Contact. Most don’t show the filtered-out numbers in the standard dashboard. Braze and Mailgun expose per-event labels. The gap between Reported and Filtered is itself a diagnostic — if your program has a very low filter rate, either your audience is unusually clean or your ESP’s filter is missing NHI that’s affecting your A/B results.
2. “What’s our click-to-session ratio by campaign, and what’s the trend over the last 90 days?”
This requires a join between your ESP event data (clicks on UTM-tagged links) and your web analytics session data. If your team can’t produce this chart easily, that’s itself the answer — it’s the most-available underused leading indicator most programs have.
3. “How has our audience’s corporate-security-scanner exposure changed over the last year?”
Mimecast rolled pre-delivery URL scanning to all customers in November 2025,13 effectively doubling per-link scanner clicks for Mimecast-protected recipients. If an increasing share of your list is behind that kind of infrastructure, your raw engagement numbers are drifting for reasons unrelated to anything your team is doing.
Talk to our team. If you’re trying to make sense of email engagement metrics that don’t add up, or you’re planning A/B tests that you don’t fully trust, reach out — we work with marketing teams on exactly this kind of analytics-integrity question.
What we’re shipping next
We’ve started by quantifying the time-from-send signal — calculating a per-campaign inflection point and showing reported metrics next to filtered ones, side-by-side. The current build pulls live activity data from Oracle Eloqua and ships with realistic mock fixtures for Adobe Marketo, Mailchimp, and other platforms so anyone can spin it up and reproduce what we’re seeing here. The reference implementation is open-source at github.com/couchassociates/truth-metrics.
Cross-source reconciliation with web analytics — the click-to-session signal from the section above — is the next layer. We’ll publish what we find as we find it. No product, no sales pitch, no gated downloads. (See also our recent piece on why open-source workflow automation is reshaping marketing technology — a different angle on the same underlying shift in how marketing operations are built.)
If this matches what you’ve been seeing in your program, we’d like to hear about it. Reply on LinkedIn, comment on this post, or reach out directly through our contact page.
FAQ
ESPs filter what they can identify cheaply — typically known bot user agents and a few obvious behavioral patterns. None publish what is filtered or expose tunable thresholds (Adobe Marketo’s 0–3 second window is the only public knob in the market). The 20–80% B2B figure from M3AAWG is from the population of events ESPs report; whatever they have already filtered is on top of that. The only way to know what is in your data is to look at it directly.
Less so on the open side because transactional emails skew toward consumer (non-MPP, non-corporate-SEG) recipients, and less so on the click side because transactional emails typically have one or two purposeful links rather than the many a marketing email contains. But the methodology applies — and a high near-zero spike on a transactional send (e.g. password resets) is often a sign of something more interesting, like an automated security tool re-clicking links during account-takeover attempts.
Look at the domain distribution of your delivered list. Lists where over 40% of addresses sit on corporate domains (anything other than gmail.com, outlook.com, yahoo.com, icloud.com, hotmail.com, and a handful of consumer providers) typically show heavy Secure Email Gateway exposure. The 20–80% non-human-click range from M3AAWG is the benchmark for that kind of audience.
Most modern ESPs do flag MPP opens, and you should be looking at the filtered open count not the reported one. But MPP is opens-only — it does not follow click links. So MPP does not pollute your click data; the click distortion is a different phenomenon (Secure Email Gateways and AI agents) and requires a different filter.
Google has not published anything specific about engagement-inflation as a deliverability signal. What is published is November 2025 tightened authentication enforcement and continued movement toward behavioral signals (real opens, replies, complaint rates). The risk we flag is that your engagement metric and Google’s engagement signal can diverge — your dashboard says 80% open rate, Google’s behavioral model sees 25% real human engagement, and Google’s placement decisions follow Google’s number. That divergence is what is worth asking about.
Receipts
- Litmus, “Where Is Email Marketing Headed in 2026.” https://www.litmus.com/blog/where-is-email-marketing-headed-in-2026-takeaways-from-litmus-live ↩
- Omeda, “The Impact of Apple’s Mail Privacy Protection 6 Months Later.” https://www.omeda.com/blog/the-impact-of-apples-mail-privacy-protection-6-months-later/ ↩
- MediaPost (covering M3AAWG’s 2020 paper), “Phantom Clicks: Non-Human Intervention Distorts Email Marketing Metrics.” https://www.mediapost.com/publications/article/357725/phantom-clicks-non-human-intervention-distorts-em.html ↩
- Inbox Collective (Dan Oshinsky), “Why Your Click Rates Might Be Inflated By Bot Clicks.” https://inboxcollective.com/why-bots-are-clicking-on-your-newsletters/ ↩
- Iterable, “Email Opens and Clicks: Human or Not.” https://iterable.com/blog/email-opens-and-clicks-human-or-not/ ↩
- HUMAN Security, “ChatGPT Atlas vs Perplexity Comet.” https://www.humansecurity.com/learn/blog/chatgpt-atlas-vs-perplexity-comet-agentic-browsers/ ↩
- Litmus, “Email Metrics That Matter.” https://www.litmus.com/blog/email-metrics-that-matter-what-to-measure ↩
- Proofpoint, “Stricter Email Authentication Enforcements from Google.” https://www.proofpoint.com/us/blog/email-and-cloud-threats/clock-ticking-stricter-email-authentication-enforcements-google-start ↩
- Kissmetrics, “GA4 Ads Click Discrepancy.” https://www.kissmetrics.io/blog/ga4-ads-click-discrepancy ↩
- SeosAndwitch, “Ad Blocking Statistics 2025.” https://seosandwitch.com/new-ad-blocking-stats/ ↩
- Kissmetrics, “GA4 Bot Spam Traffic.” https://www.kissmetrics.io/blog/ga4-bot-spam-traffic ↩
- Plausible, “Testing Bot-Traffic Filtering in Google Analytics.” https://plausible.io/blog/testing-bot-traffic-filtering-google-analytics ↩
- Mimecast, URL Pre-Delivery Action Oct 2025 release. https://mimecastsupport.zendesk.com/hc/en-us/articles/43671505743123 ↩
By Mike Couch, Couch & Associates. Couch & Associates is a marketing-technology consultancy founded in 2007. We help marketing teams pick, integrate, and operate their stack — from campaign platforms to analytics to identity. Offices in Toronto, New York, and London. Connect with our team.